
There was no change of party in any of the seats.
Loughborough South West had the highest turnout percentage on 38%, while Loughborough North West had the lowest with just 23%.
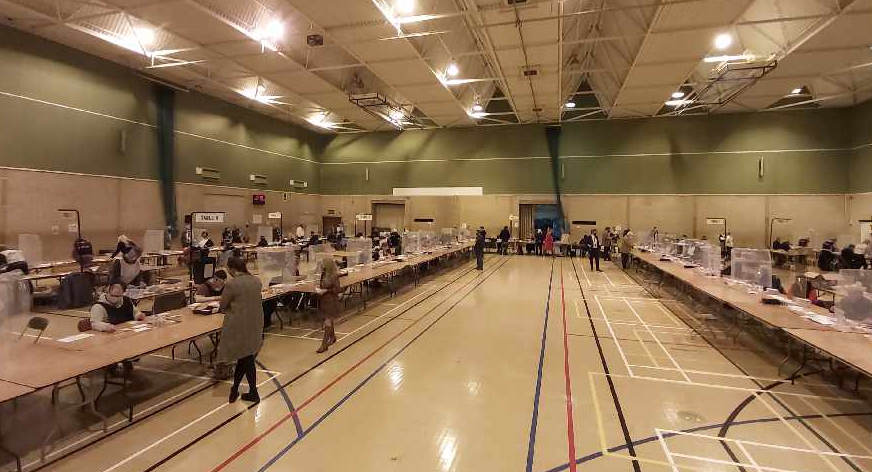
Results in Full
Birstall Division
|
Name of candidate |
Description (if any) |
Number of votes |
|---|---|---|
|
DANIEL JOHN GRIMLEY |
Conservative |
1,703 |
|
Julie May Palmer |
Labour |
1,224 |
|
Rob Hewson |
Liberal Democrat |
531 |
Conservative candidate Daniel John Grimley was elected.
-
Electorate: 10,838
-
Turnout: 32.19%
Bradgate Division
|
Name of candidate |
Description (if any) |
Number of votes |
|---|---|---|
|
DEBORAH TAYLOR |
Conservative |
2,486 |
|
Dave Berry |
Labour |
631 |
|
Philip John Edward Mills |
Green Party |
401 |
|
Kate Tipton |
Liberal Democrats |
220 |
Conservative candidate Deborah Taylor was elected.
-
Electorate: 10,464
-
Turnout: 36.05%
Loughborough East Division
|
Name of candidate |
Description (if any) |
Number of votes |
|---|---|---|
|
JEWEL MIAH |
Labour |
1,477 |
|
Judy Shields |
Conservative |
628 |
|
David Neil Kellock |
Green Party |
246 |
|
Emmanuel Charles Laurenzo Fantaisie |
Liberal Democrats |
93 |
|
Chris Cooper |
Reform UK |
86 |
Labour candidate Jewel Miah was elected.
-
Electorate: 9,687
-
Turnout: 26.35%
Loughborough North Division
|
Name of candidate |
Description (if any) |
Number of votes |
|---|---|---|
|
BETTY NEWTON |
Labour |
1,138 |
|
Julie Anne Mather |
Conservative |
1,122 |
|
Wesley George Walton |
Green Party |
214 |
|
Philip Thornborow |
Liberal Democrats |
103 |
Labour candidate Betty Newton was elected.
-
Electorate: 9,759
-
Turnout: 26.62%
Loughborough North West Division
|
Name of candidate |
Description (if any) |
Number of votes |
|---|---|---|
|
MAX HUNT |
Labour |
1,187 |
|
Pauline Carmel Ranson |
Conservative |
846 |
|
Nigel James Feetham |
Green Party |
151 |
|
Jim Adcock |
Liberal Democrats |
103 |
|
Damian Cosgrove |
Trade Unionists and Socialist Coalition |
41 |
Labour candidate Max Hunt was elected.
-
Electorate: 9,877
-
Turnout: 23.79%
Loughborough South Division
|
Name of candidate |
Description (if any) |
Number of votes |
|---|---|---|
|
TED PARTON |
Conservative |
1,318 |
|
Gill Bolton |
Labour |
1,083 |
|
Naomi Eleanor Bottomley |
Green Party |
234 |
|
Alex Guerrero |
Liberal Democrats |
105 |
Conservative candidate Ted Parton was elected.
-
Electorate: 10,141
-
Turnout: 27.27%
Loughborough South West Division
|
Name of candidate |
Description (if any) |
Number of votes |
|---|---|---|
|
JONATHAN MORGAN |
Conservative |
1,850 |
|
Rowan Myall |
Labour |
987 |
|
Aidan John Reed |
Liberal Democrats |
757 |
|
Paul Justin Goodman |
Green Party |
369 |
|
Jim Foxall |
Reform UK |
104 |
Conservative candidate Jonathan Morgan was elected.
-
Electorate: 10,568
-
Turnout: 38.71%
Quorn and Barrow Division
|
Name of candidate |
Description (if any) |
Number of votes |
|---|---|---|
|
HILARY JEAN FRYER |
Conservative |
1,952 |
|
Josh Clayton |
Labour |
1,000 |
|
Mia Alexandra Woolley |
Green Party |
373 |
|
Carolyn Thornborow |
Liberal Democrats |
158 |
|
Andy McWilliam |
Reform UK |
82 |
Conservative candidate Hilary Jean Fryer was elected.
-
Electorate: 10,366
-
Turnout: 34.58%
Rothley and Mountsorrel Division
|
Name of candidate |
Description (if any) |
Number of votes |
|---|---|---|
|
LEON HADJI-NIKOLAOU |
Conservative |
1,804 |
|
Liz Blackshaw |
Labour |
1,072 |
|
Michelle Elizabeth Nelson |
Green Party |
203 |
|
Alistair Paul Duffy |
Liberal Democrats |
141 |
Conservative candidate Leon Hadji-Nikolaou was elected.
-
Electorate: 10,290
-
Turnout: 31.51%
Shepshed Division
|
Name of candidate |
Description (if any) |
Number of votes |
|---|---|---|
|
CHRISTINE MARY RADFORD |
Conservative |
2,051 |
|
Jane Lennie |
Labour |
946 |
|
John Hounsome |
Green Party |
239 |
|
Katy Brookes-Duncan |
Liberal Democrats |
177 |
Conservative candidate Christine Mary Radford was elected.
-
Electorate: 11,372
-
Turnout: 30.24%
Sileby and The Wolds Division
|
Name of candidate |
Description (if any) |
Number of votes |
|---|---|---|
|
RICHARD JAMES SHEPHERD |
Conservative |
1,722 |
|
Andrew John Robertson Seggie |
Labour |
618 |
|
Billy Richards |
Green Party |
382 |
|
Ian Robert Sharpe |
Liberal Democrats |
187 |
|
Pete Morris |
Reform UK |
61 |
|
George Frederick Addinall |
The For Britain Movement |
37 |
Conservative candidate Richard James Shepherd was elected.
-
Electorate: 9,665
-
Turnout: 31.33%
Syston Fosse Division
|
Name of candidate |
Description (if any) |
Number of votes |
|---|---|---|
|
JAMES MARK POLAND |
Conservative |
1,820 |
|
Laurie Needham |
Green Party |
980 |
|
Samanta Zubrute |
Labour |
256 |
Conservative candidate James Mark Poland was elected.
-
Electorate: 8,499
-
Turnout: 36.09%
Syston Ridgeway Division
|
Name of candidate |
Description (if any) |
Number of votes |
|---|---|---|
|
TOM BARKLEY |
Conservative |
1,291 |
|
Louisa Clare Wait |
Green Party |
1,169 |
|
Lyndsey Helen Derbyshire |
Labour |
259 |
Conservative candidate Tom Barkley was elected.
-
Electorate: 8,757
-
Turnout: 31.22%
Thurmaston Ridgemere Division
|
Name of candidate |
Description (if any) |
Number of votes |
|---|---|---|
|
BRENDA JOYCE SEATON |
Conservative |
1,648 |
|
Abe Khayer |
Labour |
699 |
|
Nitesh Pravin Dave |
Liberal Democrats |
186 |
Conservative candidate Brenda Joyce Seaton was elected.
-
Electorate: 8,749
-
Turnout: 29.23%
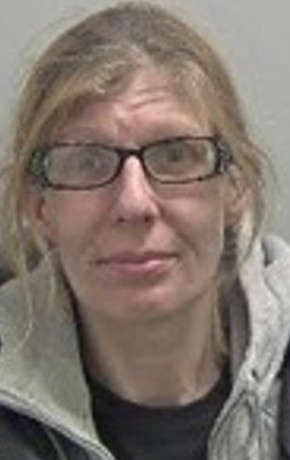 Missing Katie Love
 National Secondary School Place Offer Day
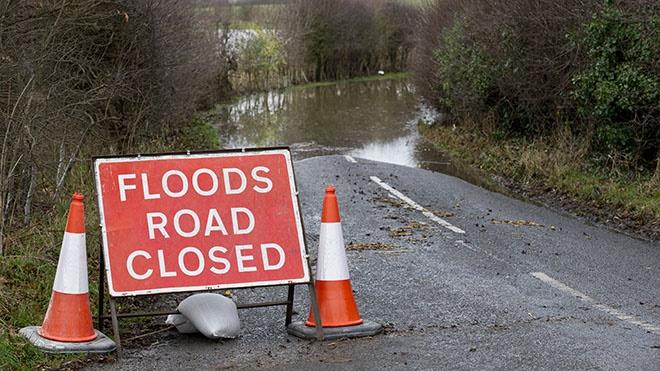 Flooding hits after days of heavy rain
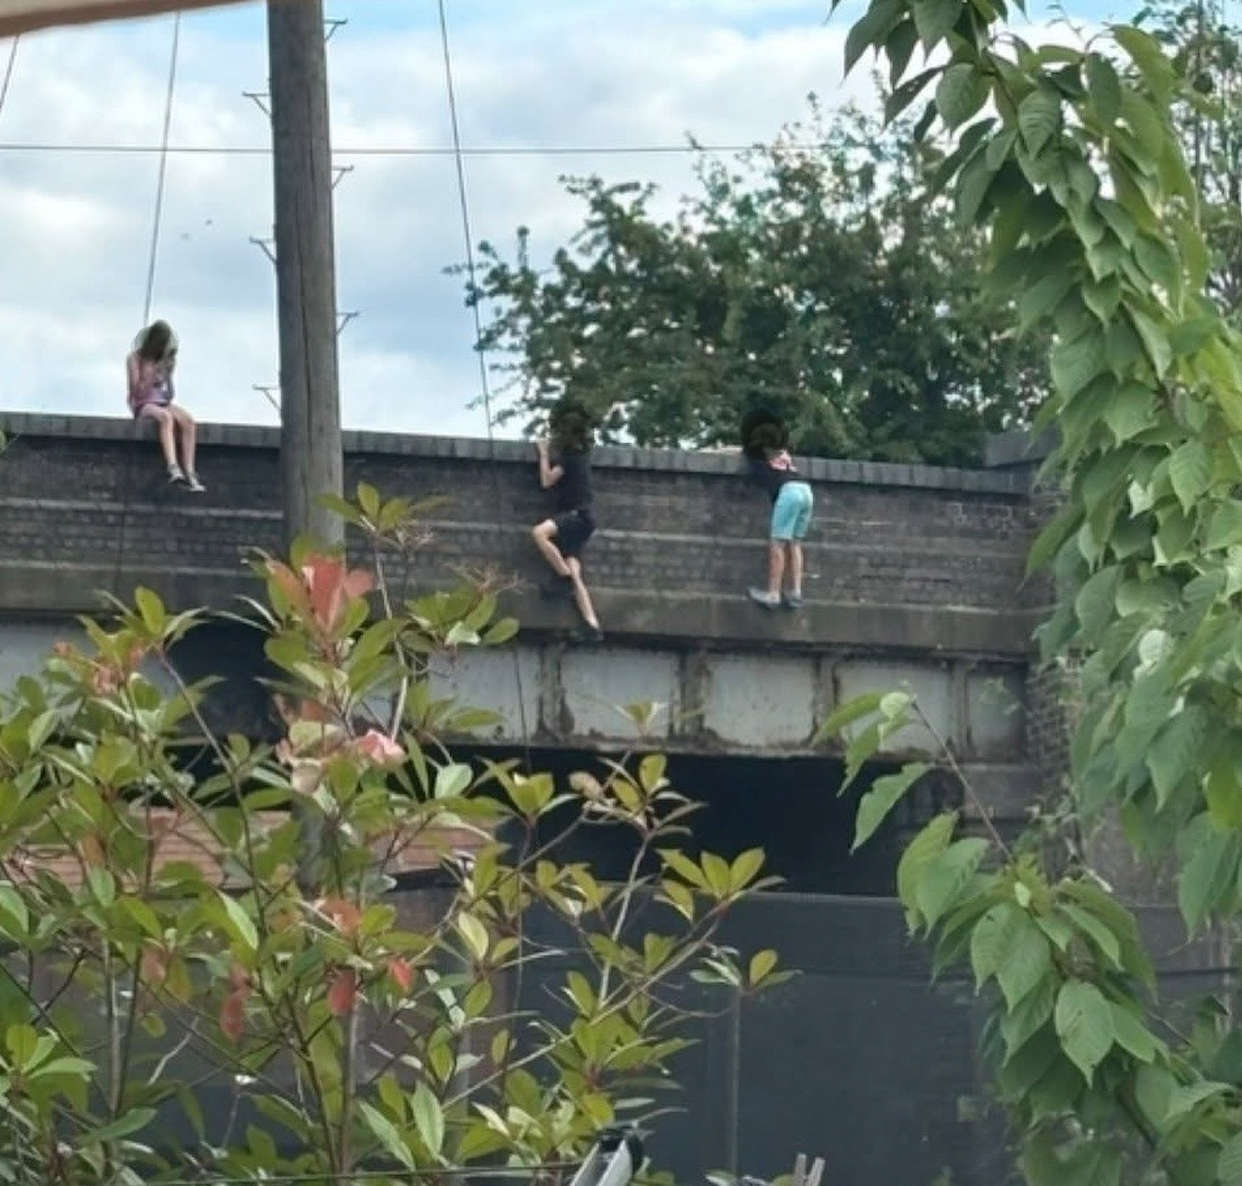 Children seeing dangling from Leicestershire railway bridge
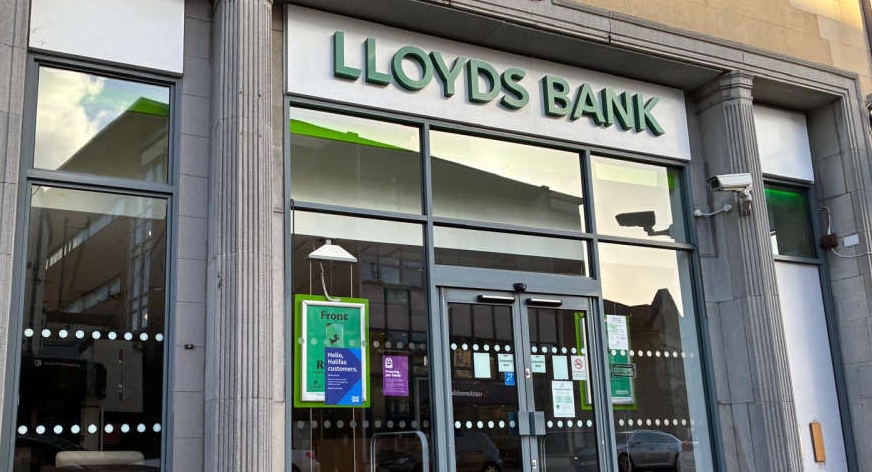 Hinckley Lloyds branch to stay open until 2027
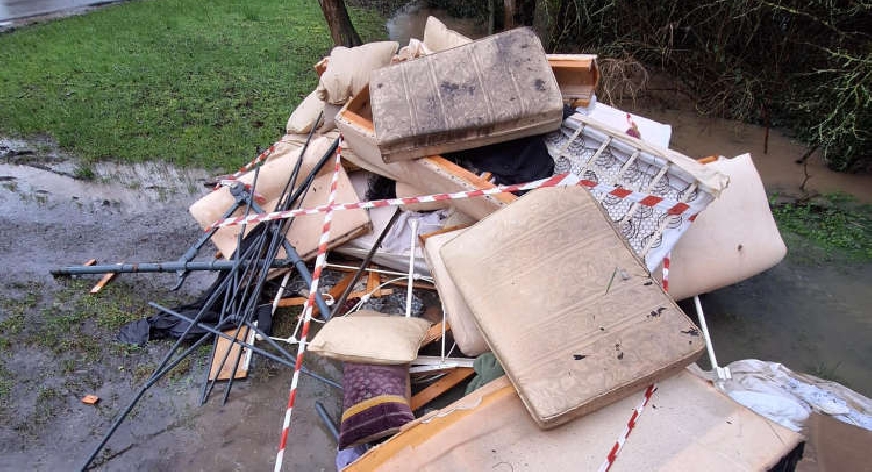 Bedroom furniture flytipped on country lane
 Emergency animal rescues by firefighters in Leicestershire